


Fresno Rental Market Trends 2026: Rent Forecast & Investor Guide
In case you are an investor in real estate, a landlord for the first time, a buyer from another state wanting to get stable rental income in California without the high prices of the coast, then this guide is just for you.
Fresno remains, in 2026, a market where smart and data-driven investors can still win, thus making it a place for investment.
Investors are intrigued to know one thing: “In 2026, where will money be the safest and smartest in Fresno?”
Fresno rental market is the one that real estate investors should pay attention to in 2026 if they are looking for steady rental income and smart growth opportunities in California.
If you are a local or out-of-state investor from the other parts of California and are ready to invest in the Fresno market, this is the opportunity you must not miss out!
Coastal cities have driven many investors to Fresno, where affordability and demand are high. The long-term potential remains a market where one can get in at a lower price, still rent, and get more over time.
The Fresno rental market has shifted over the last year towards a more balanced phase. This has been beneficial for the experience landlords and the property managers!
Although rents are still rising, demand remains quite strong, and new construction has reached a point where it is now slowing.
Thus, it creates a scenario that favors informed investors rather than speculative buyers.
First-time landlords, small-portfolio investors, or those considering creative strategies such as mid-term rentals or Section 8 housing, Fresno is the place where varied paths to solid returns exist.
In this guide, we will take a look at the latest rent forecasts for 2025 to 2026, demand and supply, a comparison between the key neighborhoods, and proven investor strategies to enhance cash flow.
At the end of the day, you will have a clear understanding of where the Fresno rental market is headed and how to set yourself up to gain from it.
The Core Numbers: Fresno Rent Forecast 2025-2026
Investors who concentrate on cash flow will notice these fundamental figures and understand why the resiliency of the Fresno rental market will be the preferred choice in 2026 over speculation.
Based on recent data and 2025 forecasts, the Fresno rental market is experiencing a balanced shift. Here, the rising inventory is meeting the steady absorption.
This can lead to moderate overall rent growth. Performance can vary significantly by asset class, with class C properties often showing stronger growth than class A.
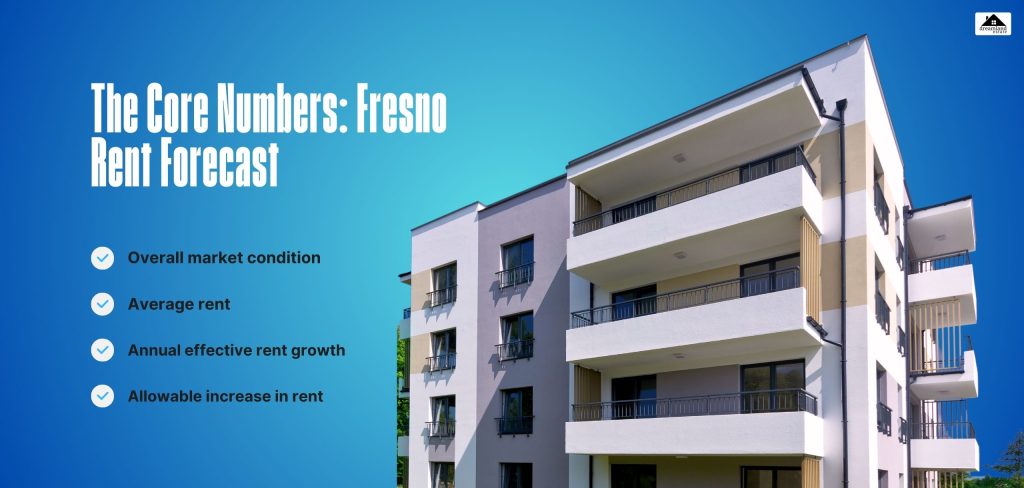
Fresno Rent Forecast 2025-2026: The Core Numbers
- Overall market condition: Balanced. The lower vacancy rate, around 4.7%, strongly indicates stability!
- Average rent (as of mid 2025): approximately $1,470 per unit.
- Annual effective rent growth (as of mid 2025): Near around 1.6%year over year!
- Allowable increase in rent (through July 31, 2026): 7.7% (5% + 2.7% CPI)
Rental Demand Vs Supply Analysis Of The Balanced Market Shift
The equilibrium speed of loanable funds is relevant when considering entry timing for long-term investment in rental real estate.
The demand-supply situation has put the Fresno market in a rebalancing stage. Although absorption remains constant, inventory increases!
Due to the high cost of development, the new supply has been very limited over the past few years.
The new units delivered, along with slower overall market activity, have caused the vacancy rate to rise slightly from historic lows.
However, consistent tenant demand (absorption) ensures market stability, preventing rent declines.
Migrations from the more expensive coastal markets in California are still driving demand for Fresno’s affordable housing, which is relatively affordable compared to other areas.
On the other hand, new construction has slowed sharply, with very few units currently being built compared to the peak in 2021.
This future supply limitation is likely to increase rent in the following years once the existing inventory is absorbed.
Rent Price Trends by Asset Class
Rent increases vary widely across property types due to factors such as supply and demand and tenant tastes.
1. Class A (Luxury/North Fresco)
The rent hike is slowing down due to the announcement of new apartments being delivered. The latest luxury apartments built in regions like North Fresno are drawing in renters.
However, they are also creating a highly competitive environment, leading to greater concessions and thus moderating rent growth.
By mid-2025, rental increases on the class A properties are extremely low or equal to those of other classes at times.
Demand in this segment has been high, but the new supply pressure restricts the possibility of significant price increases.
2. Class C (Workforce/South Fresno)
The most rapid rent increase is due to the unavailability of an affordable supply. There is a huge interest in the cheap, entry-level, and mid-range housing market in South Fresno, in particular.
A lack of new affordable supply has pushed up rents in Class C properties, which have experienced the strongest rent growth among asset classes in 2025.
Investors are focusing on these properties due to stable demand and high potential yields.
The “Traveling Nurse” Strategy (The Hidden Roi)
If you have been leasing your property on a traditional 12-month lease, you are not utilizing your property’s full potential.
The mid-term Fresno rental market, consisting of 3- to 6-month leases, is flourishing, and the main reason is the influx of professional tenants, such as healthcare workers on the move.
Why the “Mid-Term Rental” (3–6 months) is Fresno’s killer app, traveling nurses, doctors, and other contract professionals come to Fresno for temporary hospital assignments.
They need a furnished, safe, and comfortable place to stay that feels like home—not a sterile hotel room.
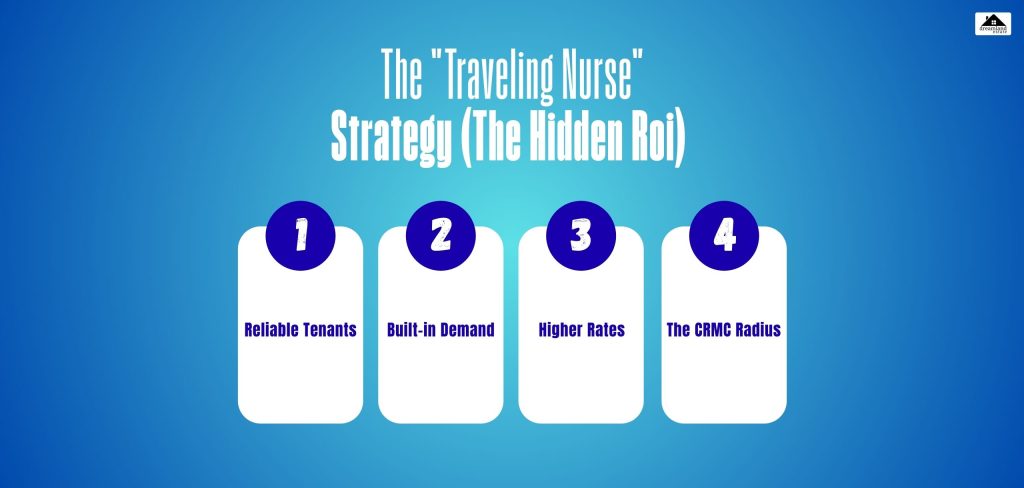
- Reliable Tenants: These renters typically have stable employment and housing stipends from their agencies.
- Built-in Demand: Hospitals constantly need temporary staff to cover shortages or specialized roles.
- Higher Rates: They are willing to pay a premium for the convenience of a furnished, ready-to-live-in home.
- The CRMC Radius: Mapping the sweet spot. Location is everything with this strategy.
The absolute “sweet spot” is the area surrounding Fresno’s major medical facilities. Community Regional Medical Center (CRMC) is the big one downtown.
CRMC is a Level 1 Trauma Center and a major employer that consistently needs traveling staff.
To maximize your booking rate and minimize vacancies, aim for properties within a 10-15 minute commute of the hospital grounds. Nurses finishing a 12-hour shift don’t want a long drive!
The Data: Long-term rent ($1,800) vs. Furnished Mid-term ($2,800+)
Let’s look at the numbers. This is where the strategy really shines, revealing that “hidden ROI.”
| Rental Type | Average Monthly Rent (Est.) | Annual Gross Income | Notes |
|---|---|---|---|
| Long-Term (12 mo. lease) | ~$1,800 | $21,600 | Unfurnished. Standard deductions/expenses. |
| Mid-Term (Furnished) | ~$2,800+ | $33,600+ | Furnished. Requires more active management but higher cash flow. |
That is over $12,000 more in gross income per year!
Yes, you may have the upfront cost of furnishing the unit, paying utilities, and managing turnover every few months. However, the premium that you can charge often significantly outweighs all these extra efforts.
So, you must embrace the travelling nurse niche, map your properties near hospitals, and watch your rental income soar!
Emerging Neighborhoods & The Seda Impact

Grasping the Southeast Development Area (SEDA) is very important for investors who are looking at areas of future growth in Fresno.
What Exactly Is SEDA? (The 9,000 Acre Question)
The SEDA comprises a vast, undeveloped 9,000-acre land area, planned for new residential and commercial developments in southeastern Fresno. It marks the main growth limit that the city has set in its plan.
The latest news on the November 2025 Planning Commission vote attracted a lot of attention and criticism.
A very important and contentious vote on the SEDA master plan was taken in November 2025 by the Fresno Planning Commission.
The approval made way for a development pipeline that will eventually provide shelter and jobs for hundreds of new residents.
But it was challenged by the opponents, citing, among other things, high infrastructure costs and adverse environmental effects.
The Concern: New projects will be subject to “Mello-Roos” taxes to cover infrastructure costs.
The financing structure is one of the major worries for home buyers and developers in SEDA.
New landowners may have to pay “Mello-Roos” style Community Facilities District (CFD) taxes.
These are used to fund a wide range of infrastructure (roads, sewers, parks) at once for the new area.
It is a high cost of ownership, which is a major factor in deciding whether to buy.
Tower District vs. Copper River
Comparing two very different pictures is a common practice for us when judging established neighborhoods for possible investments:
1. Tower District (Close to Downtown)
In case you are a young couple with kids, this location might be the ideal spot to buy a house that not only has character but also generates cash flow.
Imagine a quaint, old house having lots of character, just a short and safe walk away from restaurants, arts spots, and city entertainment—perfect for out-of-town weekends or having a quick dinner.
Here, families like yours are attracted because it provides the convenience of city living but the warmth of a close-knit community.
The best places to invest Fresno means you are not only getting a guaranteed rental income but also a place where other young families will want to live and grow close to you.
It is not just an investment; it is a way of life in a family-friendly, vibrant neighborhood.
2. Copper River (North Fresno)
On the more affluent side of the north, where the newer developments are located, Copper River is synonymous with “Appreciation.”
Residents enjoy the luxury of new and modern homes. Whereas, schools and Amenities are also not a problem.
Although rents are high, investors take a different approach here; they raise property values over time so they can sell the property at a higher price later.
Fresno Vs. Bakersfield: Where Should You Invest
Investing in the Fresno rental market versus the Bakersfield real estate market usually means giving up one thing for the other. For instance, Bakersfield can give you quick rental returns right away.
Conversely, Fresno may still be the best place for you to invest, as it has great potential for long-term appreciation and overall growth!
The Investment Comparison Between Fresno Vs. Bakersfield
Here is everything you need to know about the key metrics comparison to make your decision on which place to invest your money!
| Metric | Fresno (Mid-2025 Est.) | Bakersfield (Mid-2025 Est.) |
|---|---|---|
| Median Entry Price | ~$400,000 | ~$360,000 |
| Average Rent | ~$1,800 | ~$1,750 |
| Crime Rate | Higher than national avg. [1.5] | Higher than national avg. [1.5] |
| 5-Year Appreciation | Stronger growth | Stable growth |
The Final Verdict
If you need immediate yield, then Bakersfield is your place. The combination of lower entry prices and market-driven rents indicates that cash flow at the start will be better, as will cap rates.
Go for Fresno if you want to realize during your investment. The boomers of the population and the rise of non-agricultural sectors will keep the real estate sector thriving.
This means property prices will rise further over the next five years.
Regulatory Updates For Landlords (2025)
Big changes in landlord rules in Fresno in 2025 mainly concern ADUs and Section 8, which thus lead to new income strategies.
1. The ADU Revolution (AB 976 & AB 1033)
“No Owner-Occupancy” rule: AB 976 does away with the compulsory owner-occupancy laws, which are now valid for all time.
You can now rent out the whole house and the ADU simultaneously. This could lead to a two-fold increase in your rental density and thus your income.
Separate the sales option: AB 1033 gives municipalities the power to allow you to separate ADU sales into condos, which can provide greater sales flexibility!
2. Section 8 And Fair Market Rents (FMR
Guaranteed income strategy: By participating in the Section 8 program, you will get very dependable, government-supported rent payments.
2025 FMR Increase: For 2025, the fair market rent for a 2-bedroom unit in Fresno County will be about $1,443/month. This will provide a very stable, market-competitive rent for landlords.
The “Guaranteed Rent” Strategy (Section 8 & SAFMR)
Best For: Investors who are concerned about Fresno’s 8% unemployment rate.
In a city like Fresno, where 8% unemployment is the norm (that’s nearly double the national average), tenant job loss is your top risk. This is where the Housing Choice Voucher (Section 8) program is powerful—if you learn one specific acronym: SAFMR.
1. What is SAFMR?
Fresno now ranks among the scant few areas where Small Area Fair Market Rents are implemented.
Instead of the whole city having one rent cap, the Housing Authority pays more for landlords whose properties are in a higher-opportunity area.
2. The Strategy:
Don’t buy in the slums. Typical Section 8 investors buy in the cheapest locations. Buy in the “Gap” Zip Codes. Seek zip codes such as 93722 (West Fresno) or 93727 (Sunnyside). These are good, working-class neighbourhoods.
- The Payoff: Because these areas are considered “higher opportunity” zones, the standard for voucher payment is higher—often close to or even exceeding market rent.
You are going to receive a stable, guaranteed government check for a property in a neighborhood that is also appreciating.
- 2025 Pro Tip: Before you make your purchase, consult the Fresno Housing Authority’s specific “Payment Standard” chart by zip code.
A house located just one street away (but in a different zip code) could get you an extra $200 in guaranteed rent.
The “Hidden Tax” – Navigating the Insurance Crisis
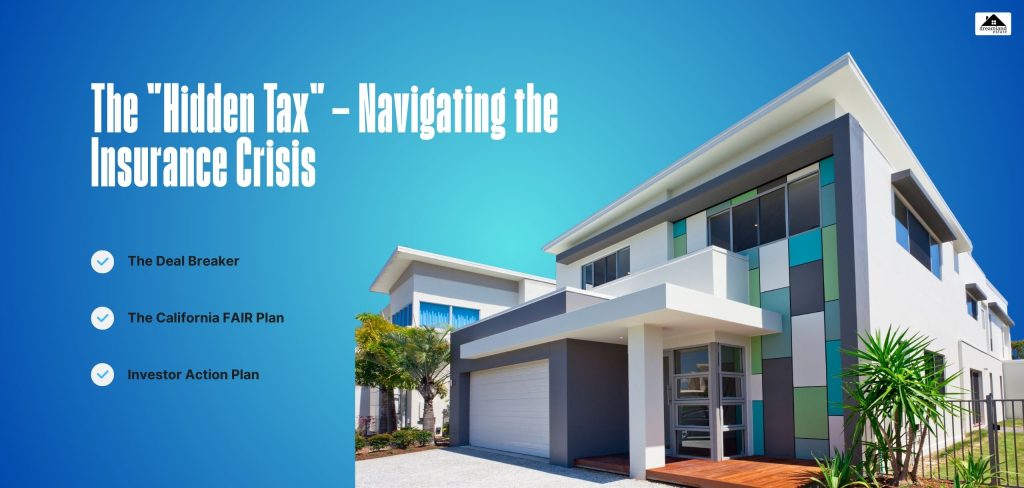
The Deal Breaker: Insurance premiums, not interest rates, are the #1 reason for the fallout of Fresno deals from escrow in 2025.
Wildfire risk modeling has led major insurers like State Farm and Allstate to either pause or limit new policies across California. Fresno is usually included in the statewide underwriting freeze, even though it is located on the valley floor, a low-fire-risk area.
The California FAIR Plan:
In case a standard carrier cannot be found, the California FAIR Plan must be used. This is an expensive “bare-bones” fire policy.
- Cost of Standard Policy: ~$900-$1,200/year (difficult to obtain).
- FAIR Plan Plus Wrap Policy: ~$2,500 – $3,500 / year.
Investor Action Plan:
The “CLUE” Report: Request the current insurance declaration page from the seller. If they possess a “grandfathered” standard policy, inquire whether it can be transferred (rare but possible).
Budget Buffer: Always enter $250/month for insurance when estimating ROI, not $100. It’s a bonus if you get it cheaper. If you write for $100 and it costs $250, your cash flow is gone.


Leave A Reply